Matched Energy: Hourly Clean-Power Scores for UK Suppliers
Most people on a “100% renewable” tariff assume the electricity arriving at the house is renewable. Usually it isn’t.
The rules behind that claim were written in 2003, when renewables were less than 3% of Britain’s power. A supplier buys renewable energy “certificates” across a year and cancels them against a year of demand, so solar generated on a July afternoon can cover the gas burned to heat a house at 6pm in January. That was a fair simplification when clean power was scarce but renewables now regularly provide more than half the grid, and the annual average hides the part that matters: the hours we still burn gas.
Joe Kwiatkowski and I created Matched to measure that gap. It is independent, not for profit, and open source.
The data was already public. What was required was joining the dots between data sources that hadn’t (to our knowledge) been combined before: NESO records renewable generation, Ofgem records who bought the certificates for it, and Elexon records what each supplier’s customers used, half hour by half hour. Line those up and you can score how much of a supplier’s demand was met by clean power at the moment it was used. We published the first year of results as the Matched Clean Power Index in October 2025.
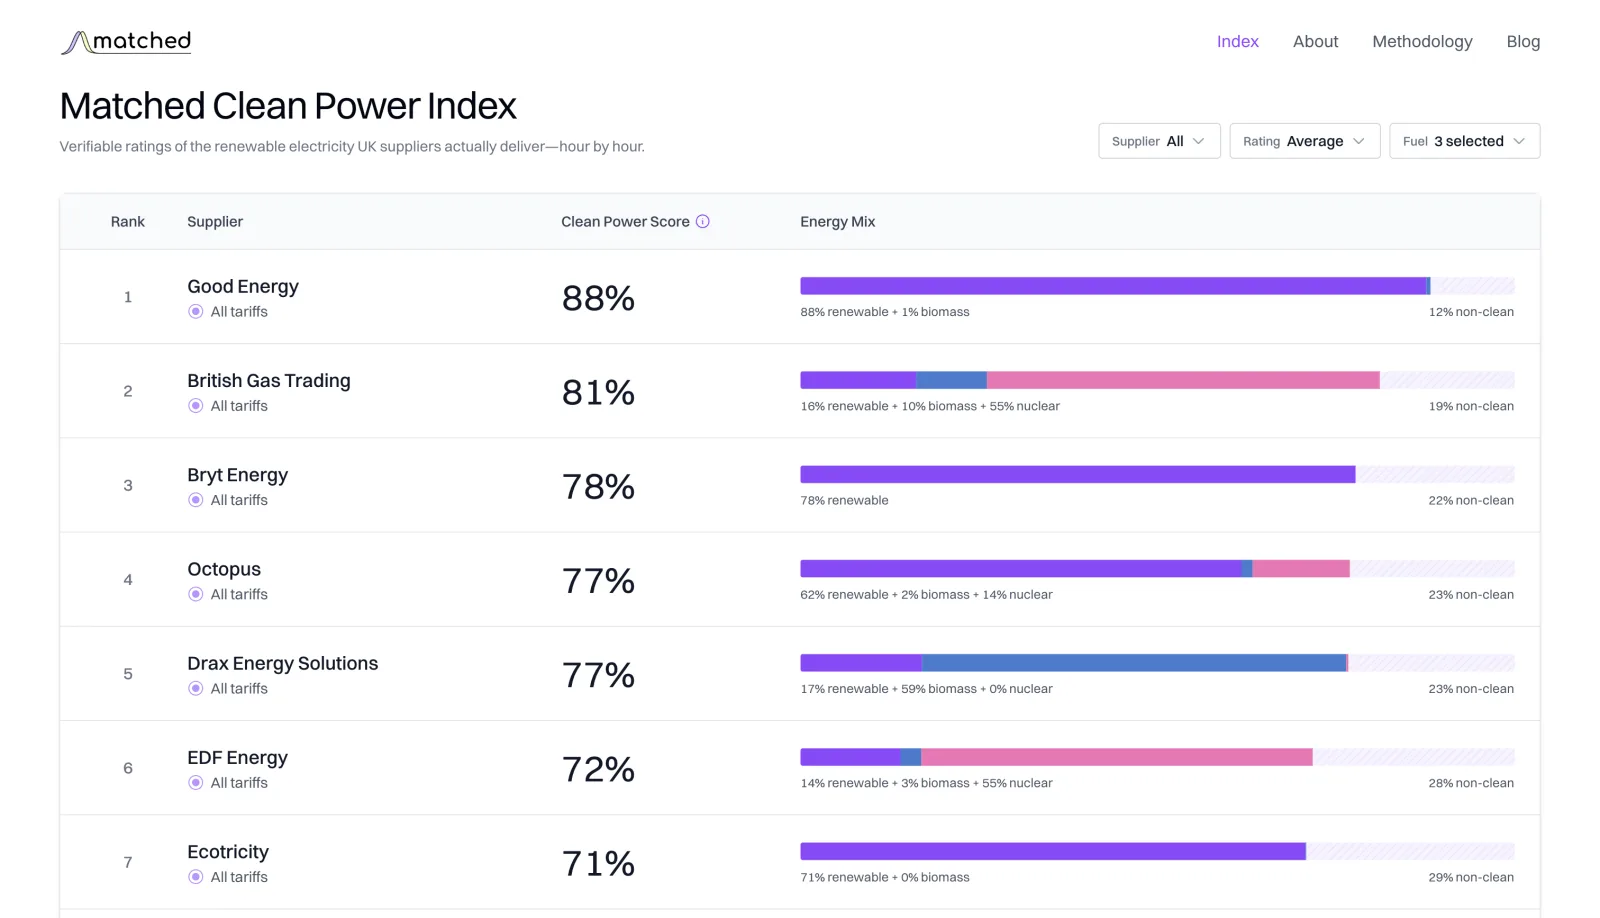
We wrote the methodology with more than 30 people across the sector, including experts from Imperial, Oxford and Princeton, several suppliers, and the organisations working on hourly matching. It is published in full, so anyone can check the arithmetic against the same public data.
My day job at Granular Energy is next door to this problem: the company helps suppliers trace clean energy through the grid, hour by hour. Matched is the public data half of the same question, done in the open and for nobody’s commercial benefit.